
Institutional investors employ various strategies to accumulate shares of companies, and one crucial aspect of their approach is the analysis of charts. Here’s a breakdown of how they go about it:
1. Industry News and Chart Monitoring:
One method involves staying informed about industry news and closely monitoring price changes through charts.
2. Delivery Statement Analysis:
Institutional investors often examine delivery statements for stocks that have been block and bulk traded daily.
3. Holding Statement Review:
They also scrutinize holding statements of shares, aided by tools like stock screeners and fundamental analysis tools available on websites.
For many, comparing highs and lows on volume charts alongside candlestick price action charts proves to be the most accessible approach. Here’s how it works:
– Volume Analysis:
After a significant purchase, the volume in a stock should decrease slightly. Green bars on the volume chart represent buying volume, while red bars denote selling volume. This information offers insights into the number of shares bought and sold. Various volume chart indicators, including on balance volume, can be used for analysis.
Let’s use Tata Motors as an example to illustrate this strategy from 2018 to September 28, 2023:
– Chart Analysis:
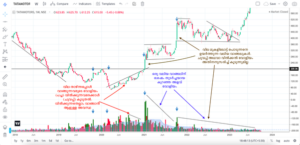
The chart reveals a downtrend throughout 2018, with the highest buying volume in November 2019 during the onset of the pandemic. Price changes during this period are disregarded.
– Rebound and Range: The stock rebounded in January 2021 with increased buying. From January to September 2021, it remained in a range with declining volume. A substantial buying volume in October 2021 pushed the stock upwards.
– Accumulation Phase: Since breaking out of the range in January 2023, the stock has been moving higher with muted buying volume. This suggests that large investors might be accumulating shares until a significant selling volume spike occurs.
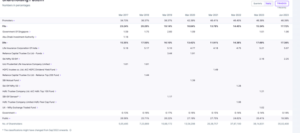
Additionally, comparing holding data for Tata Motors provides valuable insights:
– Promoter and Institutional Holdings: Promoter holding increased to 46% in January 2021, with no significant changes thereafter. DII holdings increased to 13% by September 2021, with noticeable increments in the December 2021 quarter.
– Small Investor Holdings: Small sellers’ holdings have steadily decreased from over 27% in March 2021 to just 18%. During this time, FII and DII increased their holdings.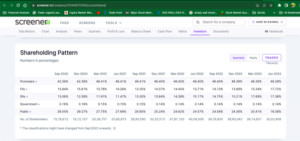
The absence of red volume bars (selling volume) above green volume bars indicates that large investors tend to buy whenever volume shrinks after a price surge. This accumulation strategy relies on the principle that there are always buyers, regardless of the amount being sold.
 In conclusion, institutional investors, like those in the case of Tata Motors, employ a combination of chart analysis and holding data to strategically accumulate shares over time, making informed decisions to maximize their positions.
Thank you for the tool
Verry good
Ok
happy good
good
Super
Good
Why this aap not working…??
Good
Really
Super
Supper
Super and good
Supper
Good really
Very good I am happy
Realy good
Good
Very nice
Good
Good
Nice
Way This Aap Not Warking
Good
Nic
Good
Good
Verygood
Most usefull
Ok
Extreme
Extreme
Extreme
Extremely nice and cool
Extremely nice and cool
Extremely nice and cool
cool
Good
Good article for inverstors
Worthy
Good